
Auto Insurance Shopping Fell to 12.6% in Q2 While Switching Rose
Just 12.6% of auto insurance policyholders shopped for new coverage in Q2 2026, yet the share who actually changed carriers climbed to 4.5%, a gap that reveals something significant about where the market is headed.


Published: Aug 7, 2026
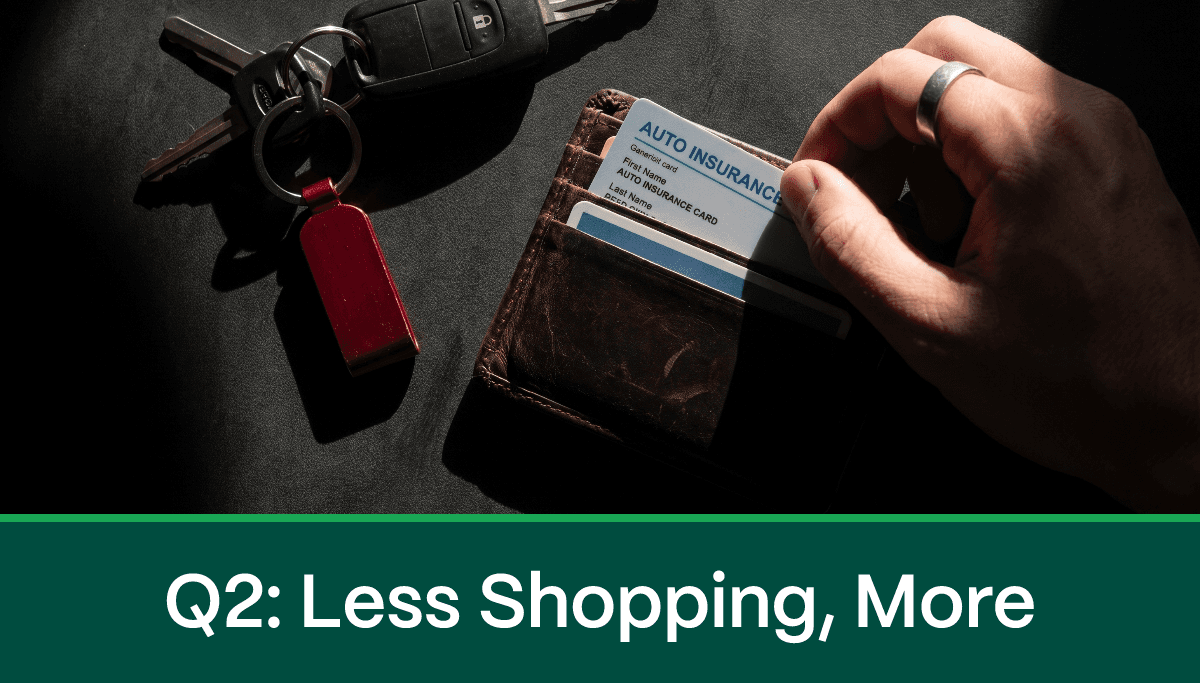
Just 12.6% of auto insurance policyholders shopped for new coverage in Q2 2026, yet the share who actually changed carriers climbed to 4.5%, a gap that reveals something significant about where the market is headed.
That counterintuitive split is the central finding from JD Power and TransUnion's latest Quarterly Insurance Signals Intelligence Report, as covered by Repairer Driven News. The data suggest the industry is moving past a frenzied, price-driven shopping era and entering a more complex phase defined by affordability stress, coverage lapses, and converging behavior across income levels. Repairer Driven News reports that the shopping rate fell 1 point quarter-over-quarter and 0.4 points year-over-year, while switching rose 0.3 points on both measures.
Shopping Cools While Switching Climbs: The Q2 Disconnect
Here is the paradox at the heart of Q2 auto insurance data: fewer people are actively comparing policies, but those who do compare are following through and changing carriers at a higher rate.
The overall shopping rate of 12.6% sounds substantial, but it represents a measurable retreat from prior quarters. The switching rate of 4.5%, meanwhile, is moving in the opposite direction. That divergence tells a story about consumer fatigue and selectivity. Shoppers are no longer browsing casually; they are entering the market with intent and leaving with a new policy.
The JD Power and TransUnion report frames this shift clearly:
"While insurance shopping remains elevated across auto and property, growth has begun to level off and shopper behavior [is] converging across credit tiers, suggesting the market may be moving beyond peak shopping intensity."
That phrase, "peak shopping intensity," is worth sitting with. It implies the frantic, rate-shock-driven shopping wave of 2022 through 2025 is receding. What replaces it is more nuanced and, for many consumers, more financially urgent.
The Save Max Quote Index, drawn from 3.3 million or more real quote requests, reflects a comparable pattern in consumer search behavior: the volume of exploratory quotes has softened, while quotes tied to imminent purchase decisions have remained relatively firm. That alignment with the JD Power and TransUnion findings is consistent with a market where tire-kickers are stepping back and serious switchers are stepping forward.
How Shopping and Switching Moved Month by Month
The quarterly aggregate obscures a volatile three-month story.
| April | Began cooling considerably | Rising |
| May | Spiked | Peaked |
| June | Reduced again | Dropped slightly |
April started the quarter with a notable deceleration in shopping. Then May reversed that trend sharply, producing a spike in both shopping and switching. June pulled both metrics back down, ending the quarter at softer levels.
That May spike is worth examining. It may reflect seasonal behavior tied to policy renewal cycles, warmer-weather driving increases, or simply a delayed reaction to Q1 premium notices landing in mailboxes. Whatever the trigger, the May surge in switching confirms that when consumers in this market do shop, they convert.
The intra-quarter volatility also cautions against reading too much into a single month's data. June's softness does not necessarily signal a sustained retreat; it may simply be mean reversion after an unusually active May.
Why the Market May Be Past 'Peak Shopping Intensity'
The structural explanation behind these numbers is spelled out in the report itself.
"Consumers with greater financial flexibility continue to actively shop for better value rather than simply accept higher premiums. Financially constrained consumers, particularly younger drivers, appear more likely to reduce or lapse coverage altogether. As shopping activity tightens, retention risk is evolving from a primarily price-driven switching issue to a broader challenge centered on affordability and coverage persistence."
That is a meaningful shift in how the industry should think about churn. For years, the primary retention threat was a competitor offering a lower premium. Now the threat increasingly comes from consumers who simply exit the market or hollow out their policies to bare minimums.
LexisNexis Risk Solutions' 2026 Auto Insurance Trends Report adds macro context. Since 2021, U.S. consumers experienced four consecutive years of sustained auto insurance rate increases. The share of policies carrying a deductible of $1,000 or higher jumped from 23% in 2022 to 33% in 2025, a direct sign of consumers self-managing affordability by absorbing more out-of-pocket risk. Consumers began to see some relief in Q4 2025, when the average premium rate at renewal declined for the first time since 2021.
Shopping volume grew 35.7% from 2022 to 2025, according to LexisNexis. But by Q1 2026, year-over-year shopping growth had decelerated to just 3.2%, turning negative in March, down from 6.9% growth in Q4 2025. The demand meter, in the language of LexisNexis, shifted from "hot" to "warm."
Who Is Winning and Losing Policyholders Right Now
The report's Loyalty Tracker, based on carriers with more than 200 responses in a quarter, shows a clear divide between carriers retaining customers and those watching them walk.
Top Five Higher-Loyalty Carriers, Q2:
- North Carolina Farm Bureau
- Tennessee Farm Bureau
- Kentucky Farm Bureau
- Erie
- USAA
Top Five Lower-Loyalty Carriers, Q2:
- Direct Auto
- Root
- Alfa
- The General
- National General
Regional Farm Bureau carriers dominate the high-loyalty list. Their model, built around agricultural communities and strong local relationships, appears to insulate them from the price-sensitivity pressures driving national market trends. Drivers in states like North Carolina, Tennessee, and Kentucky may find that local and regional options deserve serious consideration when benchmarking their current premiums.
On the acquisition side, the report notes that State Farm won the quote and acquisition battle this quarter among auto and home bundlers. That win comes despite significant recent market share pressure. Earlier in 2026, S&P Global Market reported that State Farm had lost its position as the number one auto insurer on a 12-month basis for the first time since World War II. Progressive wrote more private direct premiums in the trailing 12 months ending March 31 than any other auto insurer, exceeding State Farm by more than $1.57 billion, based on S&P's analysis of Q1 2026 statutory financial statements.
State Farm winning quotes while Progressive leads on premium volume is itself a data point: brand recognition and bundling incentives are still drawing shoppers to State Farm's pipeline even as Progressive dominates overall written premium.
The $3,200 Switcher and the Driver Who Drops Coverage Instead
Among consumers who switched carriers in Q2, the median premium amount moving between insurers exceeded $3,200. That is not a bargain-hunting exercise for a $900 policy. These are meaningful annual expenditures, and the decision to switch reflects serious financial motivation.
That figure also tells you who is in the switching pool. A policyholder spending $3,200 or more annually on auto insurance has enough premium exposure to justify the time and friction of comparison shopping and carrier change. These are, in the report's language, consumers with greater financial flexibility who are actively pursuing better value.
The other consumer profile is starkly different. Younger drivers and financially constrained households are not switching to a cheaper carrier; they are reducing coverage limits, raising deductibles, or lapsing policies entirely. The deductible shift data underscores this: one in three policies now carries a $1,000 or higher deductible, up from fewer than one in four just three years ago.
For drivers in high-cost states, these tradeoffs become particularly acute. Florida auto insurance and Louisiana auto insurance markets already carry some of the heaviest average premium burdens in the country, and the pressure to reduce coverage in those environments is intense. Understanding what minimum coverage actually means in your state before making that tradeoff is critical.
AI and Violations: Two Forces Reshaping How People Buy and Price Insurance
The JD Power report includes an early preview of a forthcoming AI Insurance Experience Study. The numbers are striking: two-thirds of consumers use AI as part of their process when researching insurance coverage. While few follow AI guidance exactly, more than one-third made a policy change based on AI advice.
The tools being used are split roughly evenly between insurer-provided AI tools and third-party platforms like ChatGPT, Copilot, and Gemini. That split matters for how carriers invest in digital experience. If a third of consumers are willing to act on AI-generated recommendations, the quality and accuracy of those recommendations has direct consequences for coverage decisions.
The LexisNexis report surfaces a separate pressure on premiums: violations. Overall traffic violations in the U.S. have returned to pre-COVID levels, with total volumes showing double-digit growth, up 13% compared to 2022. Miles driven, however, increased only 2% over the same period. The implication is that driver behavior, not increased road time, is driving the violation increase.
Distracted driving violations increased 57% across all ages compared to 2022. Among drivers aged 36 to 45 and those 66 and older, the increase was 70% or more. Violations feed directly into individual risk scores and premium recalculations, meaning a citation you received this year could affect your renewal quote for the next three years or more.
What this means for you
If you have not shopped your auto insurance in the past 12 months, the $3,200 median premium among active switchers suggests meaningful savings may be available. Use the SMQI benchmarks as a reference point before accepting a renewal quote. If your budget is genuinely constrained, raising your deductible carries real out-of-pocket risk; explore whether reducing optional coverages on an older vehicle makes more structural sense than simply going bare. If you are using AI tools to research coverage, treat the output as a starting point for questions, not a final recommendation, and verify any policy change against the actual terms of your declaration page.
What to Watch in the Second Half of 2026
Two forward signals deserve your attention.
The full JD Power AI Insurance Experience Study launches August 25. The preview data, showing two-thirds of consumers using AI in insurance research and more than one-third making policy changes based on that guidance, suggests the complete study will reshape how both consumers and carriers think about digital advice and liability for coverage decisions.
The LexisNexis demand meter shifting from "hot" to "warm" in Q1 2026 is the second signal. Year-over-year shopping growth turned negative in March. If that cooling continues into Q3, carriers may compete more aggressively on retention offers and bundling discounts, which means policyholders who proactively contact their current insurer at renewal may find more room to negotiate than existed 18 months ago.
FAQ
Why is auto insurance switching up even as shopping falls?
The JD Power and TransUnion report indicates that shoppers who are still entering the market are doing so with stronger intent than in prior quarters. Shopping volume has declined, but the conversion rate from shopping to switching has increased, pointing to a more purposeful, financially motivated shopper pool.
What does 'peak shopping intensity' mean for my renewal?
It suggests the market-wide pressure that pushed premiums sharply higher from 2022 through 2024 is moderating. The average premium rate at renewal declined for the first time since 2021 in Q4 2025, according to LexisNexis. That does not mean premiums are falling broadly, but the rate of increase is slowing, which gives consumers slightly more negotiating leverage at renewal time.
Which auto insurance carriers have the highest customer loyalty right now?
According to the JD Power Q2 Loyalty Tracker, the five carriers with the highest loyalty rates were North Carolina Farm Bureau, Tennessee Farm Bureau, Kentucky Farm Bureau, Erie, and USAA. The tracker is based on carriers with more than 200 survey responses in the quarter.
How is AI changing auto insurance shopping?
Early data from the JD Power AI Insurance Experience Study preview shows that two-thirds of consumers use AI when researching insurance coverage. Consumers are using both insurer tools and third-party platforms like ChatGPT, Copilot, and Gemini in roughly equal measure. More than one-third made an actual policy change based on AI advice.
Why are auto insurance premiums still high if relief started in late 2025?
LexisNexis data show that while average renewal premiums declined in Q4 2025 for the first time since 2021, consumers remain price sensitive and insurance costs are playing a more prominent role in vehicle purchase decisions. Four consecutive years of rate increases left consumers structurally more cautious, and factors like rising violation rates and increasing vehicle ownership costs continue to create upward pricing pressure.
About Kyle Greenwood
Kyle Greenwood is a Writer and Researcher at Save Max Auto with a decade of consumer-content experience. He specializes in explainers, longer-form features, and Q&A guides on the topics auto drivers actually search for. Read more from Kyle Greenwood →
Edited by Taleah McGuire.
Methodology
This article is grounded in the source linked above. Save Max Auto data points referenced here are drawn from the Save Max Quote Index (SMQI), a proprietary instrument reflecting 3,364,317 real consumer quote requests submitted to savemaxauto.com. State and carrier rankings reflect the lifetime dataset; year-over-year shifts reflect a rolling 12-month window. The index is refreshed monthly. External authority figures referenced (NAIC, NHTSA, state regulators) reflect the most recent public data releases available at time of writing.
Sources
- Primary source: Repairer Driven News, "Auto insurance shopping down, switching up in Q2"